Turning live NetSuite data into dashboards leadership can use
A US fashion brand sells through retail stores, wholesale accounts, department-store marketplaces and its online store. Its operational data sits in NetSuite, with Shopify supporting ecommerce sales.
Leadership wanted clear, visual reporting across every department—similar to Power BI or Qlik—but without exporting data, using another login, or waiting for overnight refreshes.
The challenge
NetSuite contained all the data the business needed, but standard dashboards could not present it in the right format.
Managers were relying on saved searches, basic KPI tiles and spreadsheet exports. Every week, teams spent hours exporting reports and manually building charts for meetings. By the time leadership reviewed the information, it was often already out of date.
The existing setup also made it difficult to:
- Compare this month with last month and last year
- Drill into the transactions behind a headline figure
- Give sales representatives a clear view of their own accounts
- Identify overdue payments, slow-moving stock or delayed orders quickly
The solution
We built custom, role-based dashboards directly inside NetSuite using live data and existing NetSuite permissions.
Each department received a dedicated dashboard:
- Retail stores
- Wholesale
- Marketplaces
- Online sales
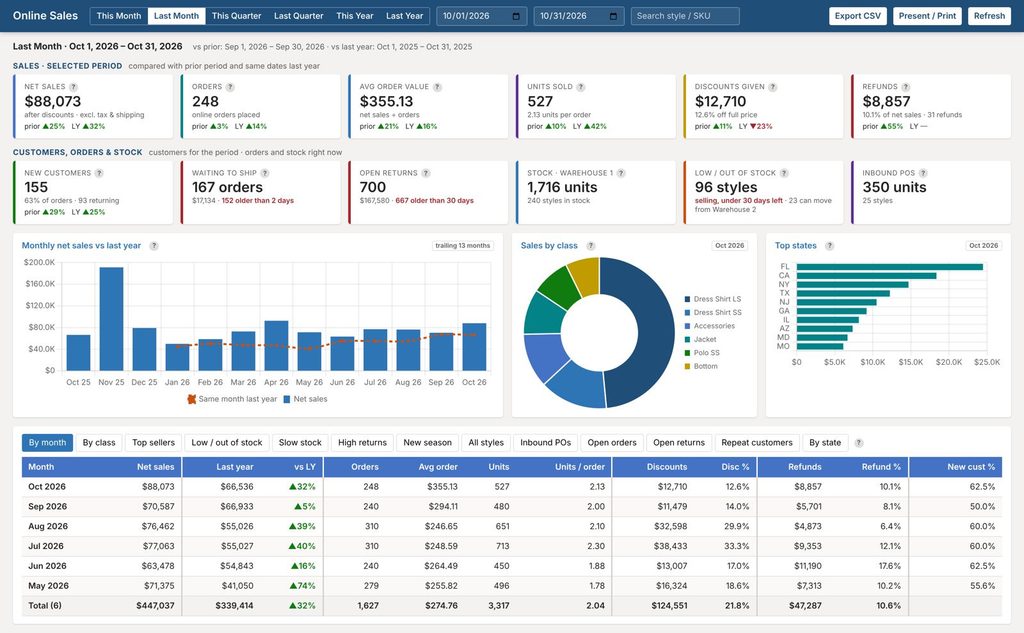
The dashboards include headline KPI tiles with month-on-month and year-on-year comparisons, sales trend charts, sales by region and class, best sellers against available stock, and detailed tables that users can sort, filter and export.
We also added action-focused views to help teams make faster decisions, including:
- Customers with overdue balances requiring follow-up
- Products that need to be reordered or transferred
- Slow-moving stock that needs attention
- Orders waiting too long to be shipped
Every metric includes a help button explaining what the number includes. Sales representatives only see their own customers and accounts, while leadership has a full business-wide view.
The result
Leadership can now review live performance across every department in minutes, directly inside NetSuite.
The weekly process of exporting data and manually building spreadsheet charts has stopped. Managers and sales teams have clearer, faster access to the information they need, while the business presents live dashboards directly to the owner from the NetSuite screen.
If your team exports NetSuite data just to create charts, those charts can often be built directly inside NetSuite.